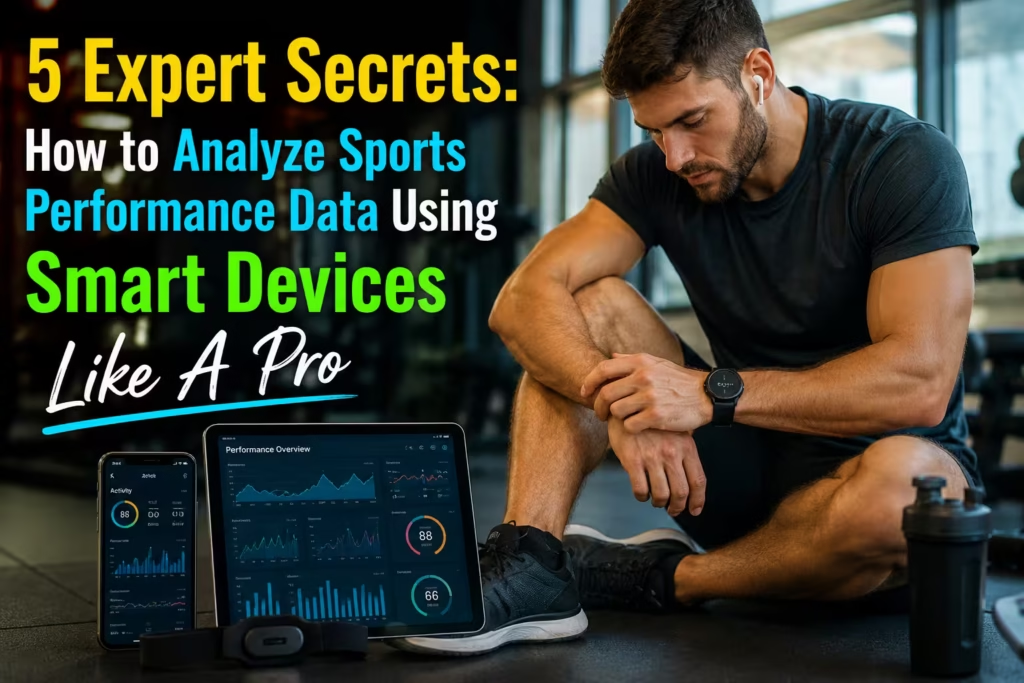

I’ve spent years watching athletes chase improvement. Some relied on instinct. The smart ones relied on data. The smartest? They knew exactly how to analyze sports performance data using smart devices and that’s where real transformation begins.
This is not just another guide. This is the playbook I wish every serious athlete had from day one.
Let’s go deep. But we’ll keep it simple, practical, and powerful.
Table of Contents
Why Learning How to Analyze Sports Performance Data Using Smart Devices Matters

Modern sports are no longer just physical. They are analytical.If you understand how to analyze sports performance data using smart devices, you can:
- Train smarter, not harder
- Prevent injuries before they happen
- Track real improvement not guess it
- Make decisions backed by data, not emotion
In my experience, athletes who embrace data outperform those who ignore it almost every time.
Types of Smart Devices for Sports Performance Data
Before you learn how to analyze sports performance data using smart devices, you need to understand the tools.
Wearables (Most Common)
These are your everyday performance companions:
- Smartwatches
- Fitness bands
- Chest straps
They track continuous physiological data and are ideal for beginners and pros alike.
If you’re just starting, don’t miss this guide: 7 Best Budget Entry-Level GPS Trackers Under $100 for Beginners (Shocking Value Picks!)
It will help you choose the right device without wasting money.
GPS Trackers (For Field Sports)
Used heavily in football, cricket, rugby:
- Track movement patterns
- Measure distance covered
- Analyze sprint intensity
Elite teams rely on GPS data to structure training loads precisely.
Want deeper insights specifically for football?
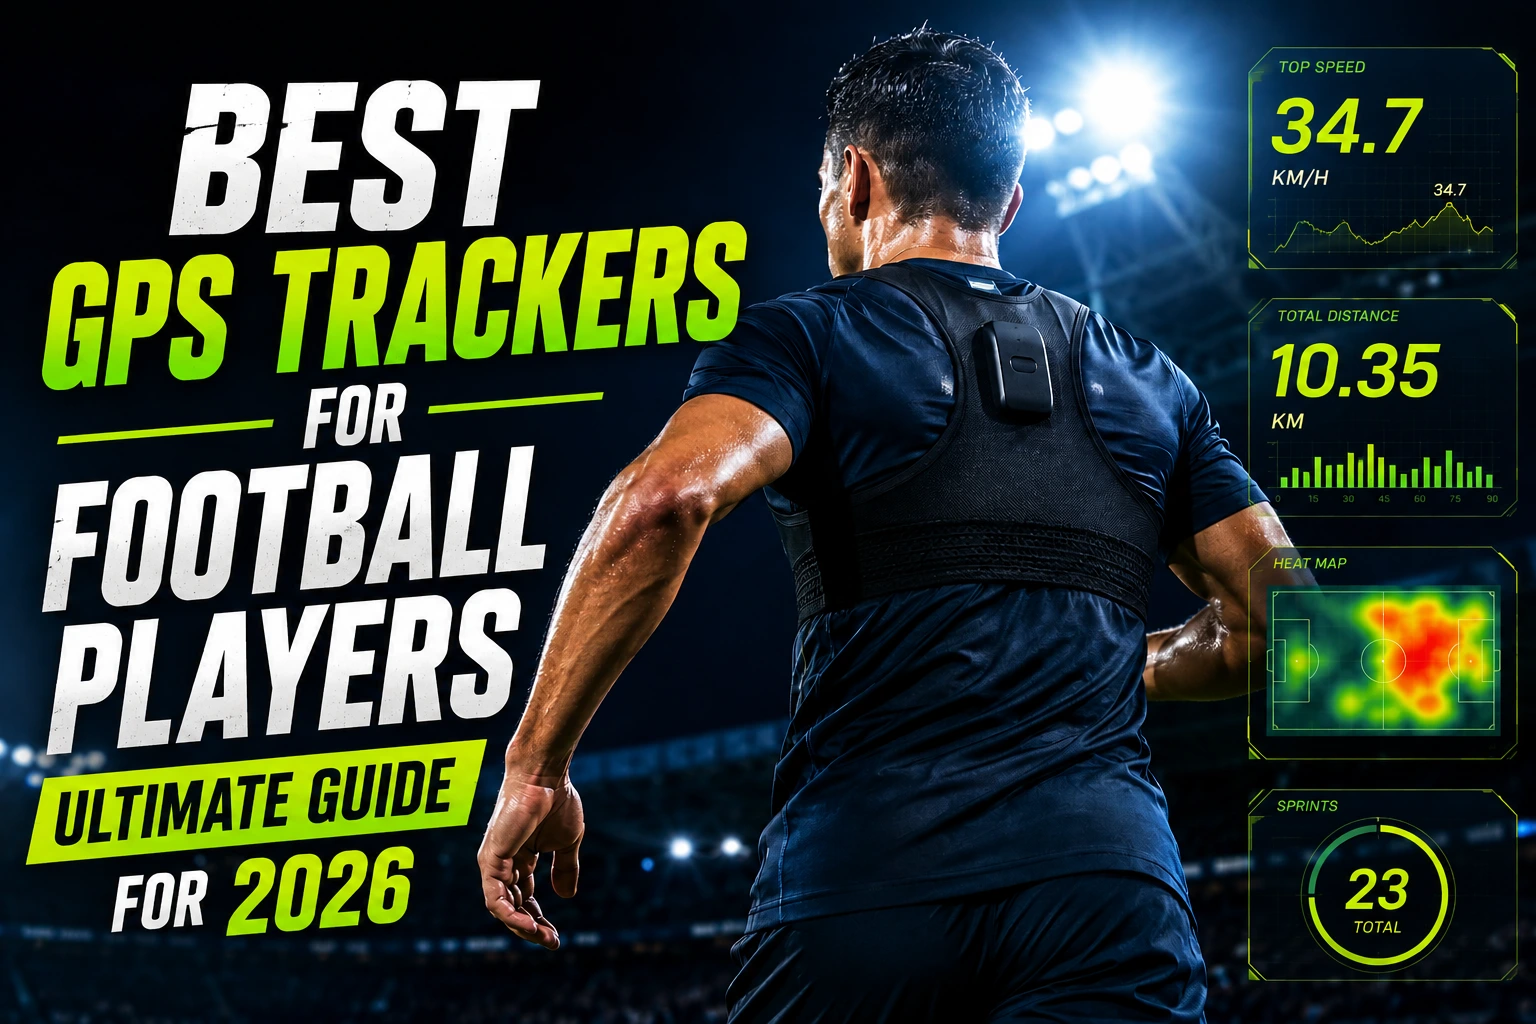
Check this: Best GPS Trackers for Football Players: Ultimate Guide for 2026
Motion Sensors & Biomechanical Devices
These are more advanced:
- Smart insoles
- Motion capture sensors
- Swing analyzers (golf, cricket, tennis)
They help break down movement something most athletes disregard for efficiency.
What Data You Actually Get (And Why It Matters)

To truly master how to analyze sports performance data using smart devices, you must understand the meaning behind the numbers.
Key Metrics You Should Focus On
- Heart Rate (HR): Indicates effort and recovery
- VO2 Max: Measures aerobic fitness capacity
- Speed & Pace: Performance output indicators
- Distance Covered: Training volume
- Training Load: Overall stress on the body
- Sleep & Recovery Data: Often underestimated but critical
Confused about how these numbers actually work in football?
Read this breakdown:
Football GPS Metrics Explained 2026: The Ultimate Way to Improve Performance
My Honest Take
Most athletes drown in data. That’s the mistake.
You don’t need everything.
You need the right metrics for your goal.
How to Analyze Sports Performance Data Using Smart Devices (Step-by-Step)

This is the core. This is where most people fail.
Here’s how I personally approach how to analyze sports performance data using smart devices.
Step 1: Define Your Goal
Ask yourself:
- Are you improving endurance?
- Speed? Strength? Recovery?
Without a goal, data is useless noise.
Step 2: Track Consistently
Consistency beats complexity.
- Use the same device
- Track at the same time daily
- Avoid switching tools frequently
Data becomes powerful only when it’s consistent.
Step 3: Identify Trends (Not Single Data Points)
Never judge performance from one session.
Look for:
- Weekly improvements
- Patterns in fatigue
- Changes in recovery rate
This is where real insight lives.
If you want to understand how tracking accuracy impacts your results, this is critical:
Step Counting vs GPS Running Distance Accuracy 2026: Which One Is Truly More Accurate?
Step 4: Compare Effort vs Output
This is elite-level thinking.
Example:
- Same run distance
- Lower heart rate
That means you improved.
This is the essence of how to analyze sports performance data using smart devices.
Step 5: Adjust Your Training
Data without action is pointless.
Use insights to:
- Increase intensity
- Reduce overload
- Add recovery days
And remember, performance is not just physical.
Your mindset matters too:
7 Sports Psychology Tips to Boost Athlete Confidence Fast
Tools and Apps That Help You Analyze Data
Understanding how to analyze sports performance data using smart devices becomes easier with the right platforms.
Popular Tools
- Garmin Connect
- WHOOP App
- Apple Health
- Strava
- Polar Flow
What These Tools Do
- Visualize your data
- Show trends automatically
- Provide recovery insights
- Suggest training adjustments
For science-backed training methodologies, check resources from the National Strength and Conditioning Association (NSCA).
My Opinion
Apps are helpful but don’t rely on them blindly.
They assist. You decide.
Real Examples of Data Analysis (This Is Where It Gets Real)
Let me show you how how to analyze sports performance data using smart devices works in real life.
Example 1: Runner Improving Endurance
- Week 1:
- 5 km run
- Avg HR: 165 bpm
- Week 4:
- 5 km run
- Avg HR: 150 bpm
Same distance, lower heart rate = better endurance.
Example 2: Football Player Using GPS Tracker
- Sprint distance increased by 20%
- Total fatigue also increased
Decision: Reduce training intensity to avoid injury.
Want to go deeper into football tracking systems?
Read:
Best GPS Trackers for Football Players: Ultimate Guide for 2026
Example 3: Gym Athlete Tracking Recovery
- Poor sleep + high training load
- Performance dropped
Solution: Add recovery day → performance improves next session.
Common Mistakes to Avoid
Even if you know how to analyze sports performance data using smart devices, mistakes can ruin progress.
Avoid These at All Costs
- Overanalyzing every small metric
- Ignoring recovery data
- Comparing yourself to others
- Switching devices frequently
- Trusting inaccurate data blindly
The Biggest Mistake
Not taking action.
Data is only valuable when it changes your behavior.
How to Use This Knowledge Like a Pro
Now that you understand how to analyze sports performance data using smart devices, here’s how to level up:
- Focus on 2–3 key metrics
- Track weekly, not daily emotions
- Combine data with body awareness
- Keep learning and adjusting
These sources provide reliable, real-world data.
Final Thoughts (From Experience)
I’ve seen talented athletes fail because they ignored data.
And I’ve seen average athletes rise to elite levels because they mastered how to analyze sports performance data using smart devices.
The difference is not talent.
It’s awareness.
And discipline.
If you apply what you’ve learned here even 50% of it you’ll already be ahead of most athletes.
FAQs: How to Analyze Sports Performance Data Using Smart Devices
1. What is the best smart device for sports performance tracking?
It depends on your sport. Garmin and WHOOP are excellent for overall performance, while GPS trackers are best for field sports.
2. How often should I analyze my performance data?
Weekly analysis is ideal. Daily tracking is fine, but decisions should be based on trends.
3. Can beginners use sports data effectively?
Absolutely. Start simple—focus on heart rate and activity level.
4. Is smart device data always accurate?
Not always. It’s reliable but not perfect. Always combine data with personal experience.
5. What is the most important metric?
There is no single metric. However, heart rate and recovery data are extremely valuable for most athletes.
6. How long does it take to see improvement?
With consistent tracking and analysis, noticeable improvements can appear within 3–6 weeks.
Conclusion
Mastering how to analyze sports performance data using smart devices is no longer optional it’s essential.
The athletes who win today are not just strong.
They are informed.
And now, so are you.
For real-world explanations of these metrics and how devices interpret them, explore the Garmin Official Blog.